Interactive data visualization
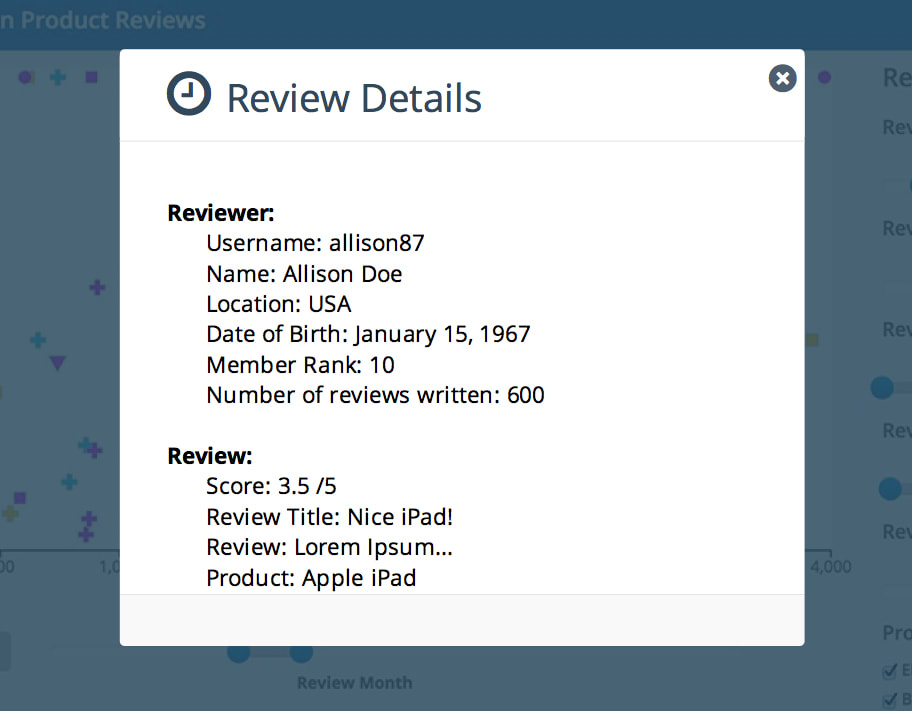
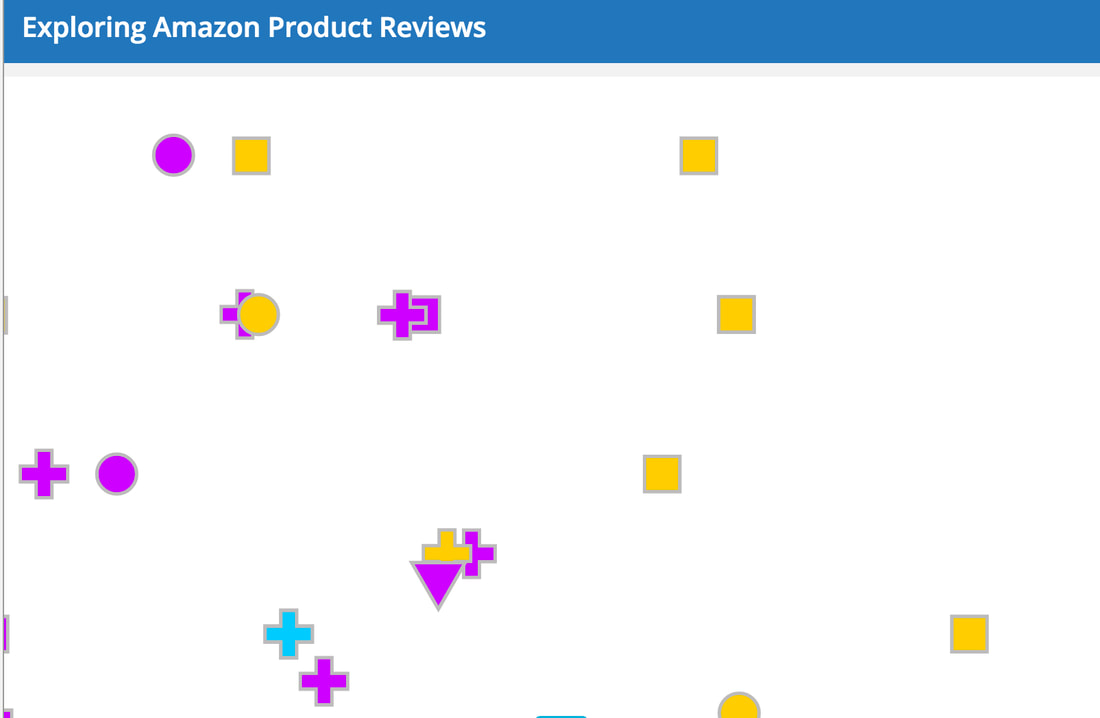
I developed an interactive visualization which allowed users to explore a mined dataset of amazon product reviews. The goal was to educate them about data mining by allowing them to manipulate and explore various aspects of the mined dataset.
Dataset: Amazon product reviews mined by researchers at the data mining and machine learning research group at the University of Illinois at Chicago (UIC). They created the dataset by crawling amazon.com in June 2006, collecting review data spanning nine years (1998-2006). The final dataset contained 5.8 million reviews of 6.7 million products from 2.14 million reviewers. I obtained permission from the researchers to use the dataset for this project.
Development technology: I used the AWK programming language to explore, parse, and transform the large dataset, and created the visualization using HTML5, D3, and CSS.